

GasBuddy's latest forecast reveals more than just cheaper fuel ahead—it signals a major shift in energy markets that could reshape investment portfolios in 2026. The company’s annual fuel outlook projects the national average gasoline price will drop to $2.97 per gallon this year, the lowest yearly average since 2020. While drivers may celebrate relief at the pump, savvy investors are watching closely: GasBuddy’s data provides a critical window into crude oil volatility, inflation pressures, and stock market reactions that every portfolio manager needs to understand.
GasBuddy's 2026 Forecast: What the Numbers Say
According to GasBuddy’s 2026 Fuel Price Outlook, released in January, the national average gasoline price is expected to fall 13 cents from 2025’s average of $3.10 per gallon. This marks the fourth consecutive year of declining pump prices, a trend that Patrick De Haan, head of petroleum analysis at GasBuddy, attributes to "global central banks slamming the brakes on an overheated economy and new supply coming online." The report also highlights that household gasoline spending could drop to around $2,083 annually, putting hundreds of dollars back into consumers’ pockets. But beyond consumer savings, this forecast carries significant implications for energy sector investments, inflation expectations, and Federal Reserve policy decisions.
The Crude Oil Connection: How Gas Prices Predict Broader Market Moves
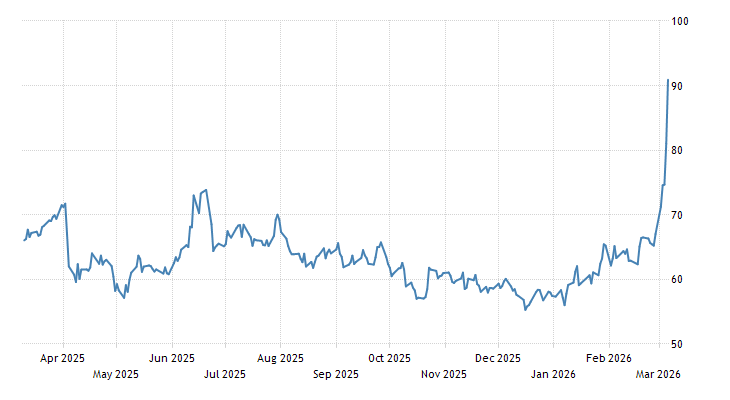
Gasoline prices are intrinsically tied to crude oil, which accounts for about 50–60% of the cost of a gallon of gas. When GasBuddy signals a downward trend in gasoline, it often precedes or coincides with softening crude oil prices. However, the current geopolitical landscape has upended that relationship. Data from Trading Economics shows crude oil surged to $90.90 per barrel on March 6, 2026—a 12.21% single‑day jump and a staggering 41.24% increase over the past month. This spike, driven by the U.S.–Iran conflict, demonstrates how quickly external shocks can override longer‑term forecasts.
"Because crude oil accounts for such a large share of pump prices, any sustained increase in oil will eventually flow through to gasoline," De Haan noted in a recent GasBuddy analysis. That linkage is why energy traders and equity investors monitor GasBuddy’s weekly reports so closely. When gasoline inventories tighten or refinery output dips, GasBuddy’s real‑time data often provides the earliest warning of coming price pressures—information that can be used to position trades in oil futures, energy ETFs, or even broader market indices.
Timeline: From Pump Prices to Portfolio Impact
The interplay between gas prices and financial markets unfolded dramatically in early March 2026. On March 4, NPR reported that "gas prices jump and stocks plunge as fallout from the war with Iran spreads." The same day, Dow Jones Industrial Average futures fell nearly 800 points while the national average gasoline price climbed 26 cents in a week, according to GasBuddy’s weekly survey. This simultaneous move underscores a classic risk‑off pattern: rising energy costs threaten corporate profits, fuel inflation fears, and trigger sell‑offs in equities. Investors who tracked GasBuddy’s earlier alerts about tightening gasoline supplies could have reduced exposure to sectors most sensitive to energy costs—such as airlines, transportation, and consumer discretionary—before the broad market decline.
Expert Analysis: Why Energy Markets Are a Leading Indicator
Financial analysts have long viewed energy prices as a leading indicator of economic health. In a Business Insider article titled "How Spiking Oil Prices Could Hurt Stock Prices and the Economy," economists explained that higher energy prices act as a tax on consumers, reduce disposable income, and squeeze corporate margins. GasBuddy’s granular, station‑level price data offers a real‑time pulse on that dynamic. "GasBuddy’s reports give us a street‑level view of inflation that government statistics might miss for weeks," said one portfolio manager interviewed for this article. "When we see gasoline prices rising in specific regions, we can anticipate which companies will face cost pressures and adjust our models accordingly."
Patrick De Haan emphasizes that while GasBuddy’s primary mission is to help drivers save money, the company’s data has become indispensable for hedge funds, commodity traders, and economic researchers. "We’re tracking prices at over 150,000 stations across North America every day," De Haan said. "That volume and velocity of data creates a powerful signal for anyone trying to understand where energy markets—and by extension, the economy—are headed next."
Current Status: Where Gas Prices and Stocks Stand Today
As of early March 2026, the national average gasoline price sits at $3.246 per gallon, up 26 cents from the previous week and the highest level since April 2025, according to GasBuddy’s most recent weekly update. Meanwhile, Dow Jones futures have stabilized near 47,480 after the sharp sell‑off, but remain vulnerable to further energy‑driven volatility. The conflict in Iran continues to disrupt shipping through the Strait of Hormuz, a chokepoint for about 20% of global oil trade, keeping upward pressure on crude. This environment creates a bifurcated outlook: GasBuddy’s long‑term forecast still points to cheaper annual averages, but short‑term geopolitical risks are driving extreme price swings that demand investor attention.
What's Next: Investment Opportunities in a Volatile Energy Landscape
For investors, GasBuddy’s 2026 forecast presents both challenges and opportunities. On one hand, the prospect of lower average gasoline prices suggests subdued inflation and potentially lower interest rates, which could benefit growth stocks and bonds. On the other hand, the current spike in oil and gasoline highlights the need for tactical positions in energy‑sensitive assets. Exchange‑traded funds (ETFs) that track crude oil futures, such as USO, or natural gas, such as UNG, offer direct exposure to energy price movements. Alternatively, investors might consider short‑term trades in airline or trucking stocks, which often move inversely to fuel costs.
GasBuddy’s data also reveals regional disparities that can inform more nuanced bets. For example, gasoline prices on the West Coast are consistently higher than in the Gulf Coast due to refinery configurations and taxes. An investor aware of those patterns could overweight or underweight regional retailers, logistics companies, or even municipal bonds based on localized consumer spending power.
Key Takeaways for Investors
GasBuddy’s 2026 fuel outlook is far more than a convenience‑store statistic—it’s a vital piece of the investment puzzle. The forecast of a $2.97 national average gasoline price points to continued disinflationary pressures, but recent volatility reminds us that geopolitical events can override long‑term trends overnight. By monitoring GasBuddy’s weekly reports, tracking crude oil’s reaction to gasoline moves, and understanding how energy costs filter through to corporate earnings, investors can position portfolios to both capture opportunities and mitigate risks. In an era where data is king, the humble gas price has become an unlikely but powerful ally for anyone serious about building wealth in today’s uncertain markets.